A hundred stores is a hundred live situations.
One compromised till is a local problem. The same pattern across a dozen stores points to organized fraud, and you cannot see the second if you look at stores one at a time.
In plain termsSpot patterns that only appear across stores, and price the response.
How one pattern spreads across stores
An illustration of the first four days, compared with how it is usually found.
Retail entities are independent in space and coupled in money. A store, a lane, a till, an online checkout and a member account each carry their own state, and a shared driver across them is the signal that no single store’s report contains.
One payment pattern across stores · illustrative
- Day 1: One till declines more cardsLooks local, and under every rule's limit
- Day 2: Three stores, one tender typeA shared driver shows in store state
- Day 3: Flagged as one patternRanked by money at stake
- Day 4: Action priced and appliedCost to act beside cost to wait
- Week 3: Finance finds itThe usual way: at reconciliation, after the money has moved
- Phase: Visible in store statefrom One till declines more cards to Flagged as one pattern
- Events are shown in order, not to scale.
Why it is found late
- It surfaces in reconciliation. Losses appear in a finance cycle weeks later, when the tender pattern has moved on and the money is gone.
- Rules fire per transaction. Thousands of alerts a day bury the pattern across stores, because nobody is looking at state across a region.
- The response cannot be priced. Nobody can say whether blocking a tender type recovered more than it cost in declined legitimate sales, so the policy stays as it is.
What moves in a store
| State | What moves it (baseline) | What moves it unexpectedly (residual) |
|---|---|---|
| Payment integrity | Transaction volume, trading hours, basket mix, seasonality | Tender manipulation, card testing, chargeback patterns |
| Refund pressure | Returns policy, season, product mix | Refund abuse, staff collusion |
| Gift-card exposure | Promotions, holiday cycles | Draining, cloning, bulk activation |
| Availability | Replenishment schedule, demand | Supplier failure, mis-picked distribution |
| Store posture | Footfall, staffing, day of week | Localized fraud clusters, equipment failure |
Retail state is dominated by schedule and season, so the baseline is most of it. The learned residual exists to catch the part that is not scheduled, which is the part that costs money.
What you would see
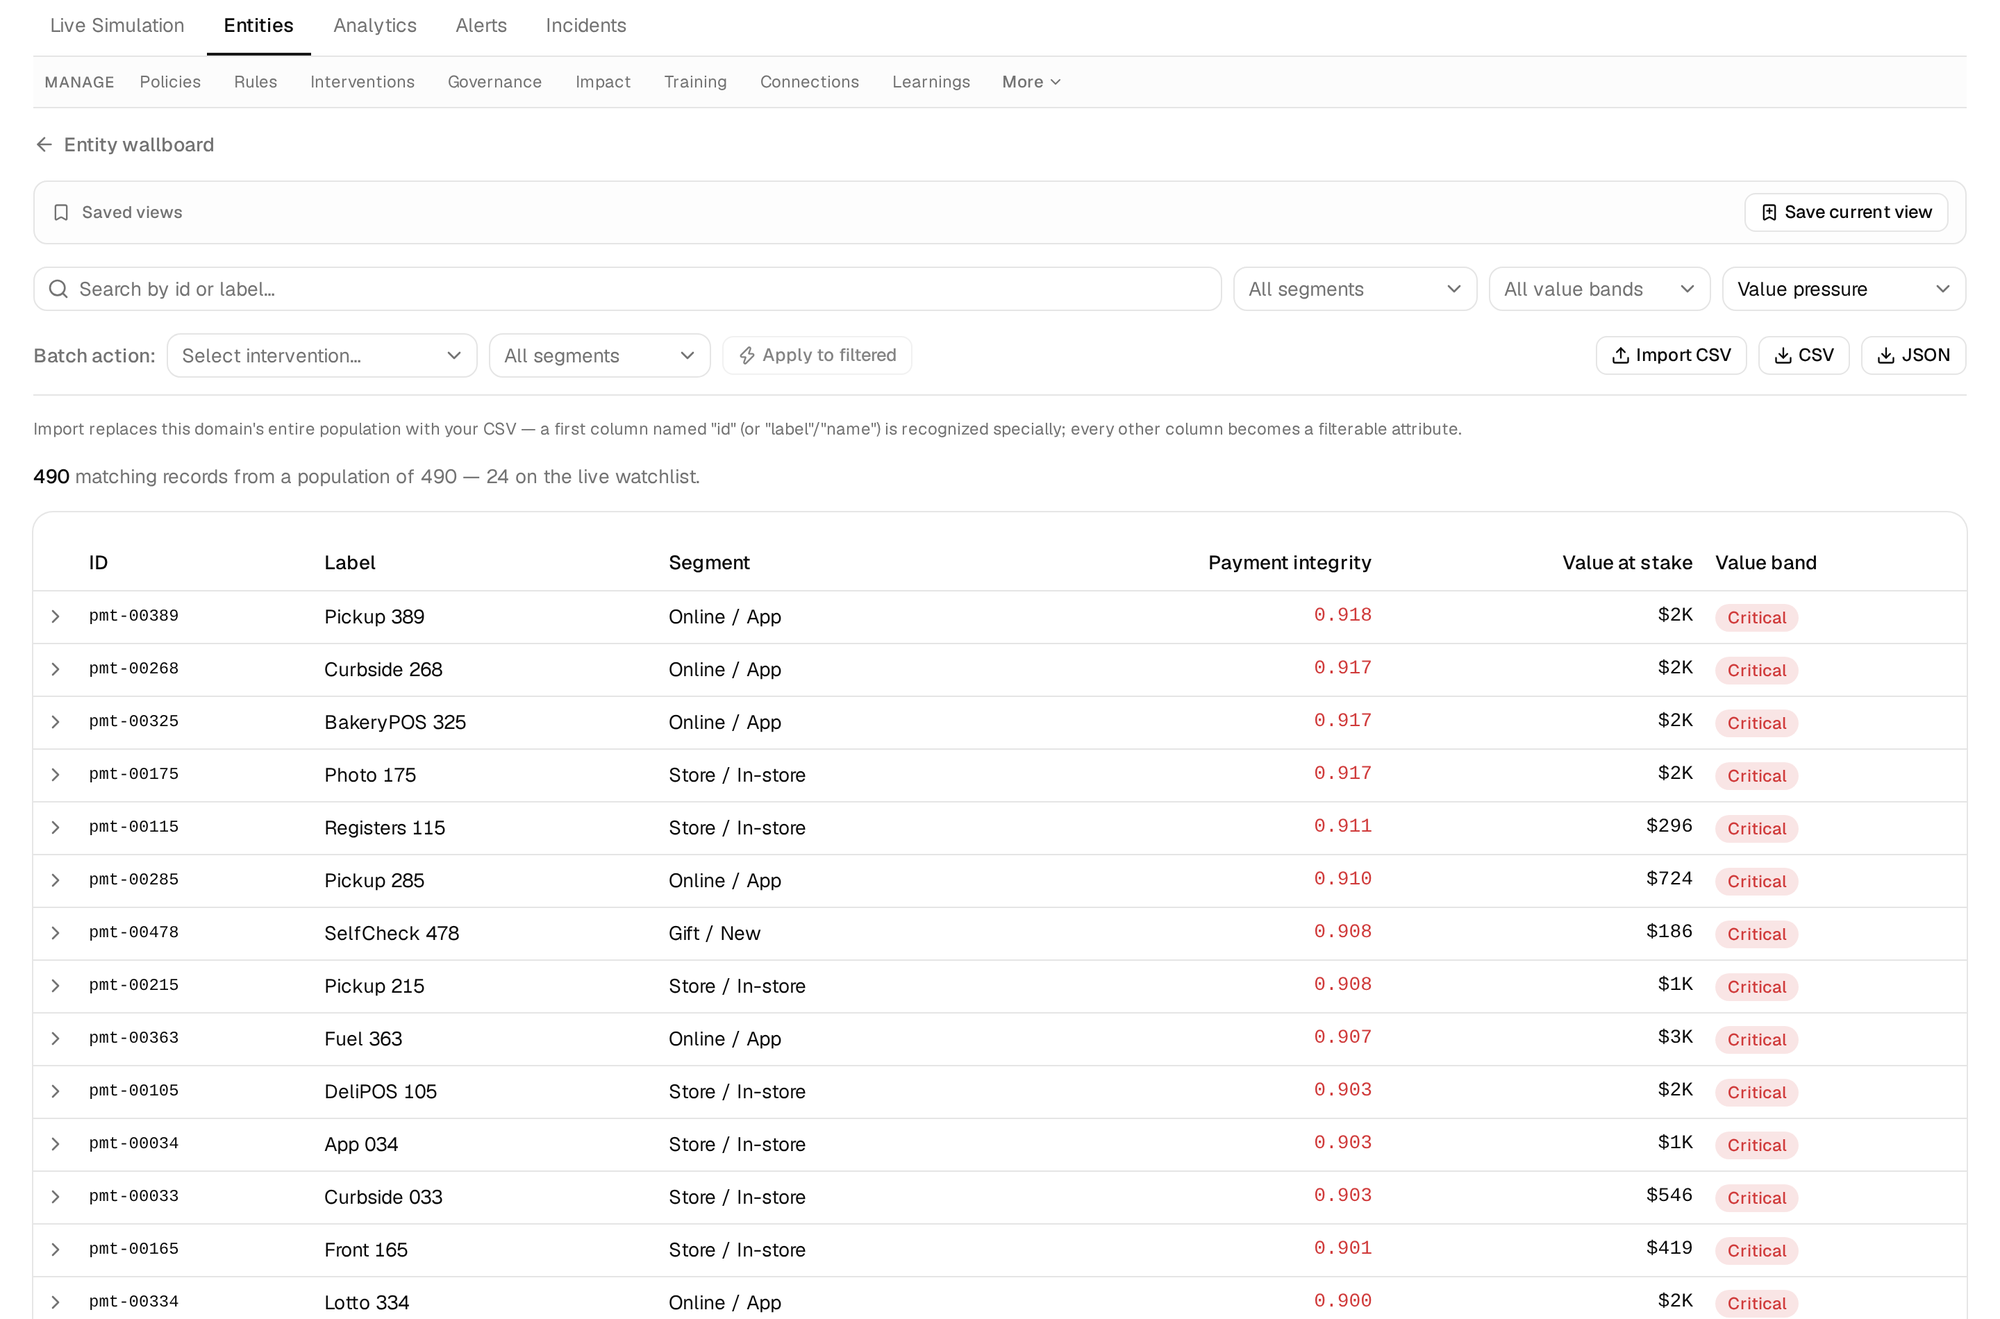
- Stores and accounts ranked by value at stake, with band and trend
- One entity’s trajectory against its events
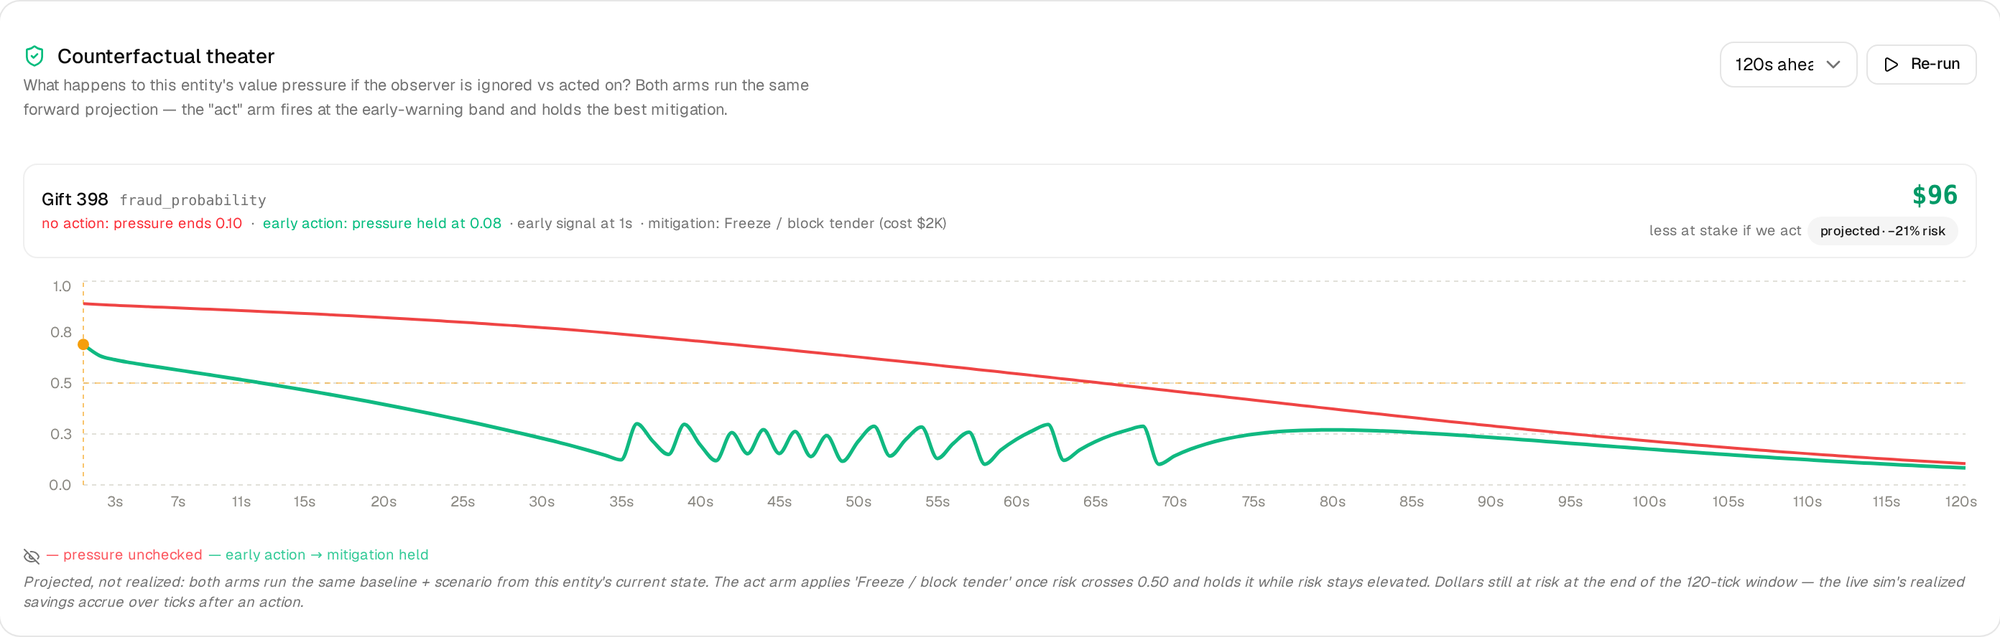
- An intervention’s expected effect and its cost, side by side
- The what-if, recomputed in your own browser
State dimensions and intervention costs are domain configuration, so a grocery chain, a fashion retailer and a fuel network each define their own. Currency is stated on every cost surface.
A worked example
A hundred stores, a fifth of them acted on, and the arithmetic laid out.
Round, illustrative figures for stores: they show the arithmetic, leave out the subscription, and are for you to change in the calculator.
| Input | Value | What it stands for |
|---|---|---|
| Stores in scope | 100 | Everything the team is responsible for |
| Value at stake per one | $12,000 | Fraud and refund exposure at one store over the horizon |
| Cost of the action per one | $400 | Blocking a tender type and reviewing the store’s accounts |
| Share acted on | 20% | The stores ranked highest by value at stake: 20 of 100 |
| Modeled, USD | Pessimistic | Expected | Optimistic |
|---|---|---|---|
| Share of value at stake avoided | 10% | 25% | 40% |
| Cost to act, in total | $8,000 | $8,000 | $8,000 |
| Avoided loss | $24,000 | $60,000 | $96,000 |
| Net position | $16,000 | $52,000 | $88,000 |
Break-even is 3.3%: each action costs $400 against $12,000 at stake, so it has to avoid that share of the loss to pay for itself.
What exists today
OgMart, a 100-store demo retailer across 15 departments, is the live reference world. Retail is the industry with a running demo.
Watch a hundred stores at once
See the queue, the evidence and the priced action on the demo, then on your own region.